Nifty went past Thursday's high of 20356, but bank nifty still has not done so and is lagging behind Need to see a lot more momentum in banking stocks as they catch up with the market.
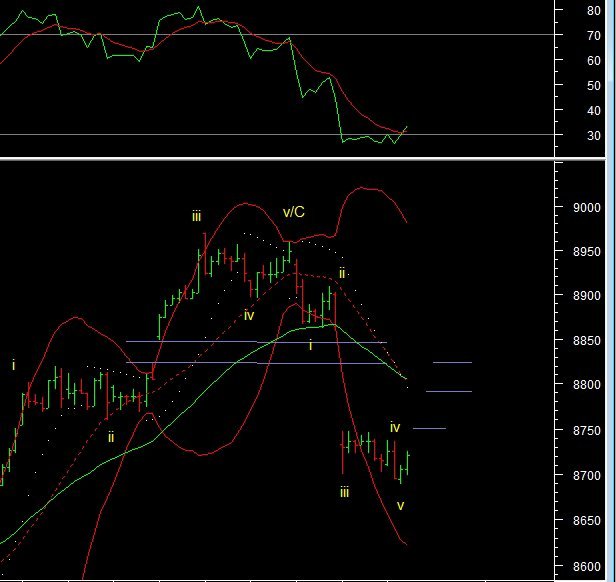
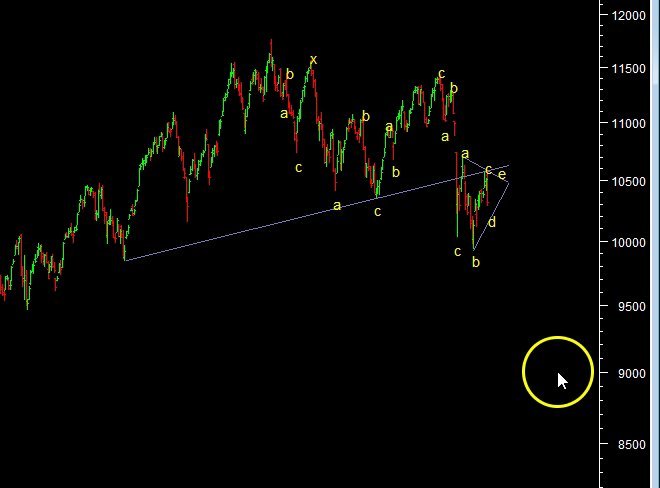
Fear is back but looking for some more confirmation that the rise in A-B-C is complete and that this dip today is only an X wave, and another A-B-C up will unfold. Need a little more confirmation with supports at 8821 and 8715 to be watched.
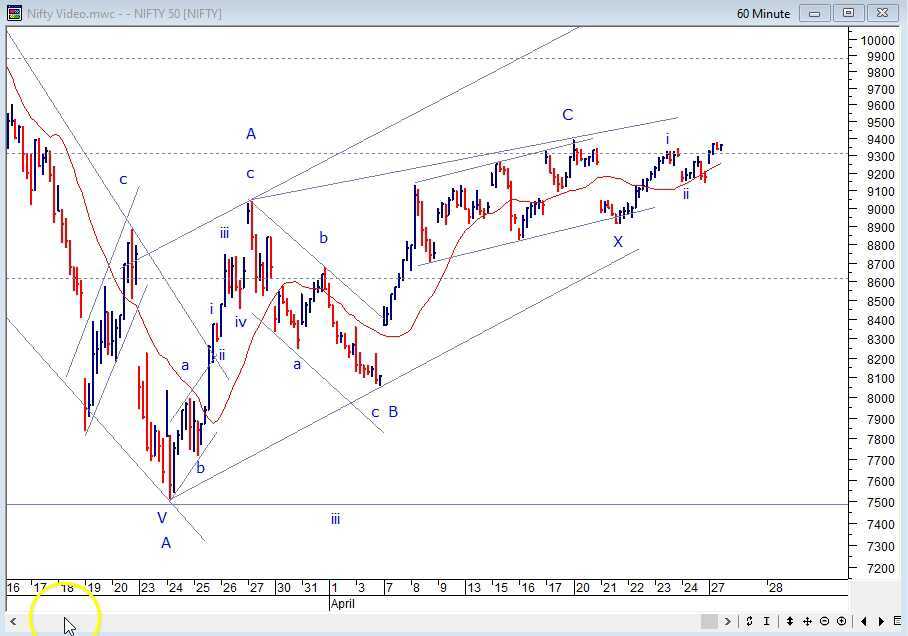
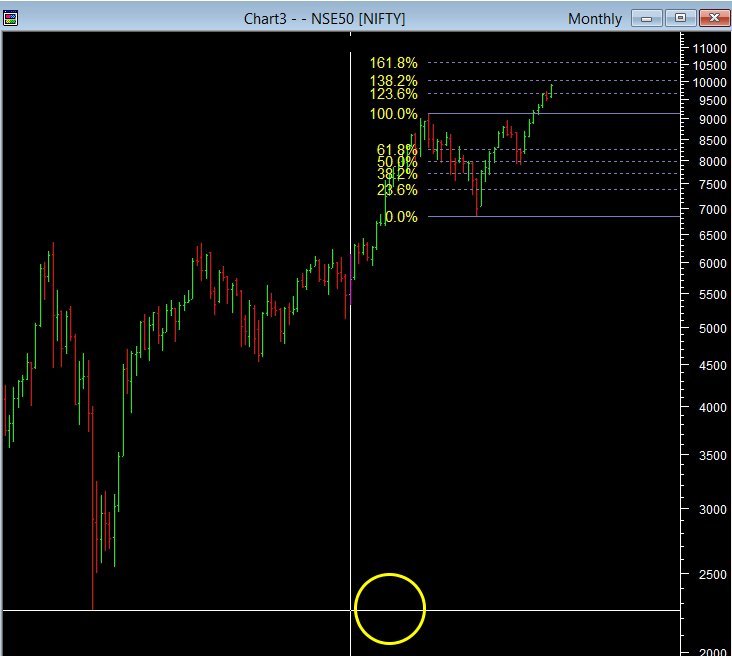
Nifty is bouncing back in wave IV of A and we can test the previous swing high near 8883 or the 38.2% retracement mark at 9000 before heading lower.
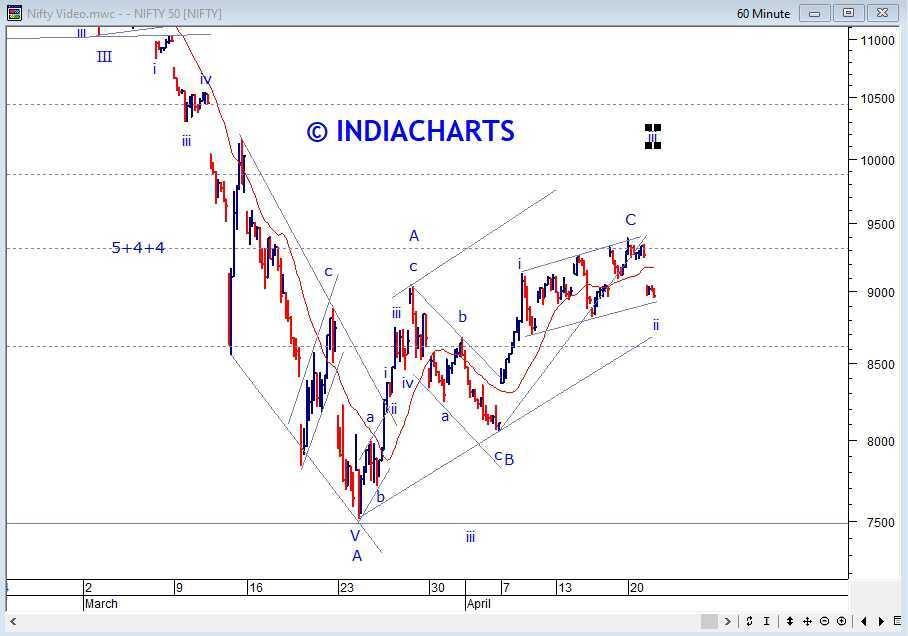
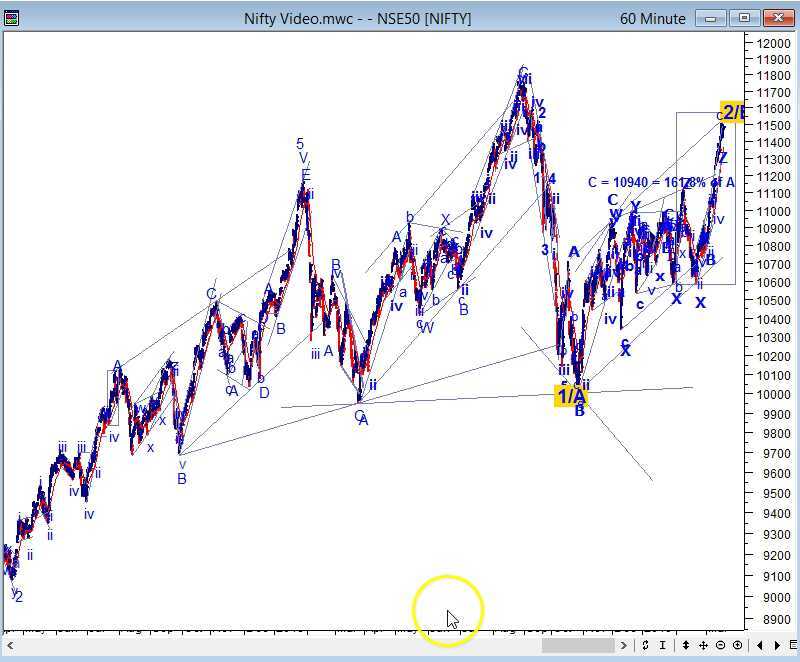
Nifty is stretching towards the C=A=10570 mark and can develop an ending diagonal at this point before a reversal, 10300 being an important support. Wide range and so we are seeing India vix jump a lot today
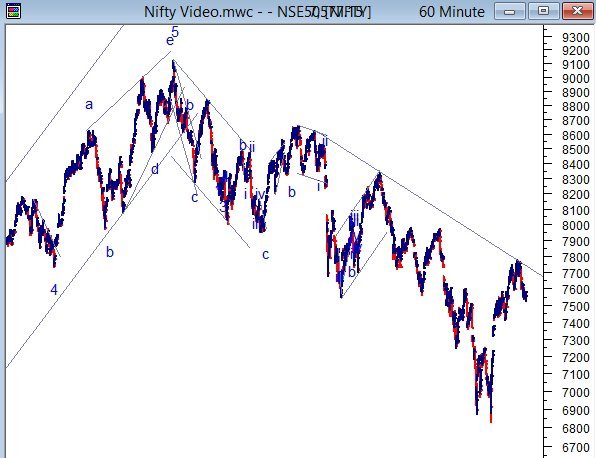
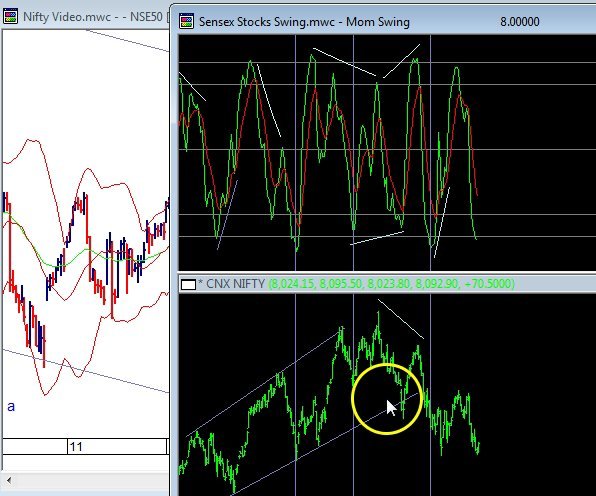
The nifty markings are not always changed for the past data on my video charts as they reflect my last explanation. Making them today. Do not confuse them with the final outcomes then marked in the Nifty daily end of day report.
Nifty is in wave II up and wave a is near complete, a-b-c- will complete it eventually at a higher retracement.
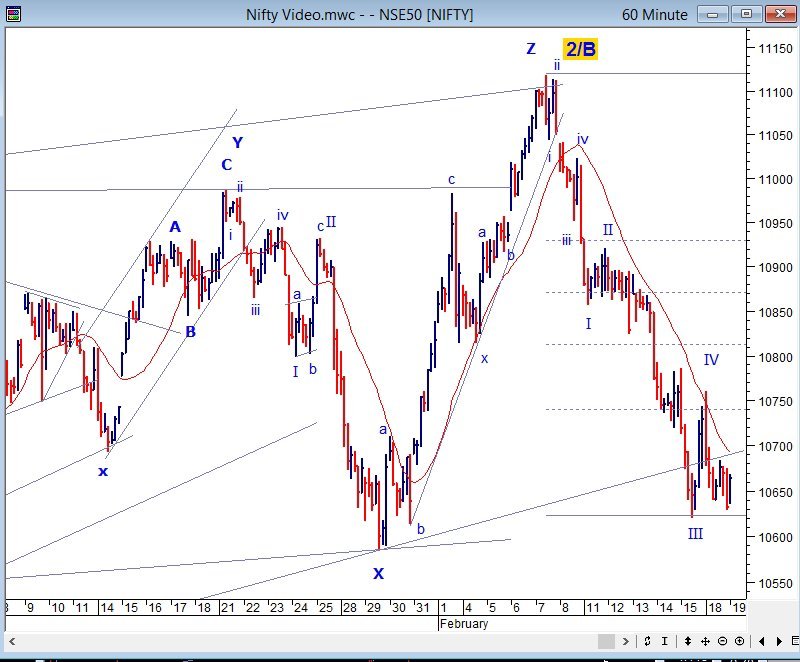
Nifty may have started wave II up today and then is open to multiple retracements from 10788-10850-10912, before wave III down and bank nifty to a best case near 27550 before the next wave lower. The next few days watch out for this to play out
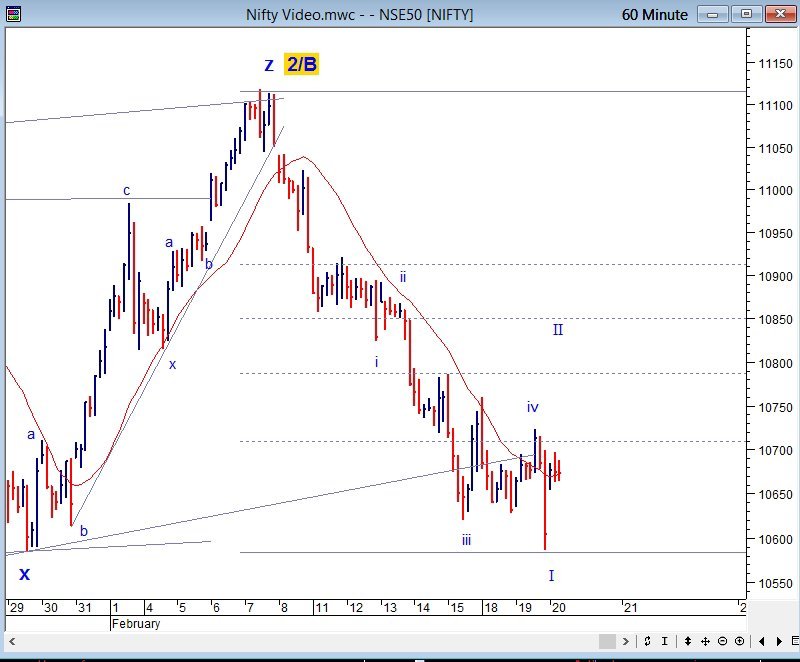
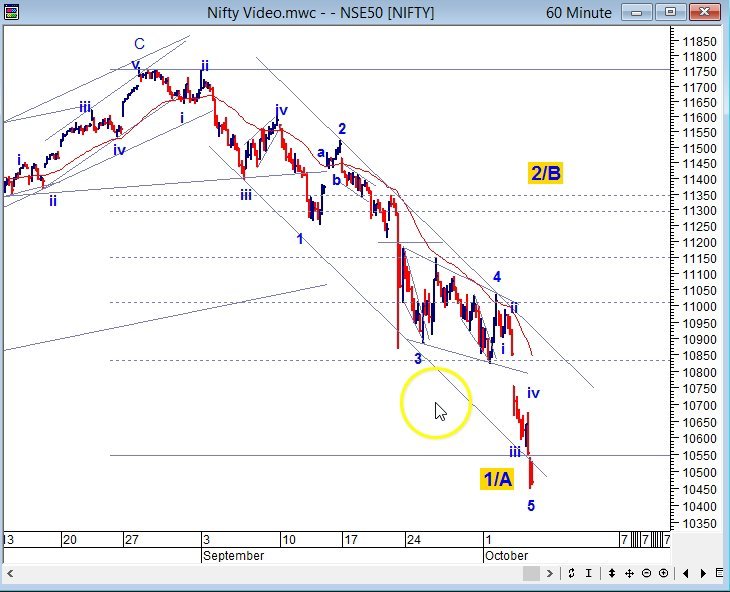
Nifty can complete wave I and bounce in wave II, there are many subdivisions in the fall so we cannot be sure. Any bounce will be small and counter trend and might be resisted at the 20dma at 10817. The larger trend is down. 5 mins
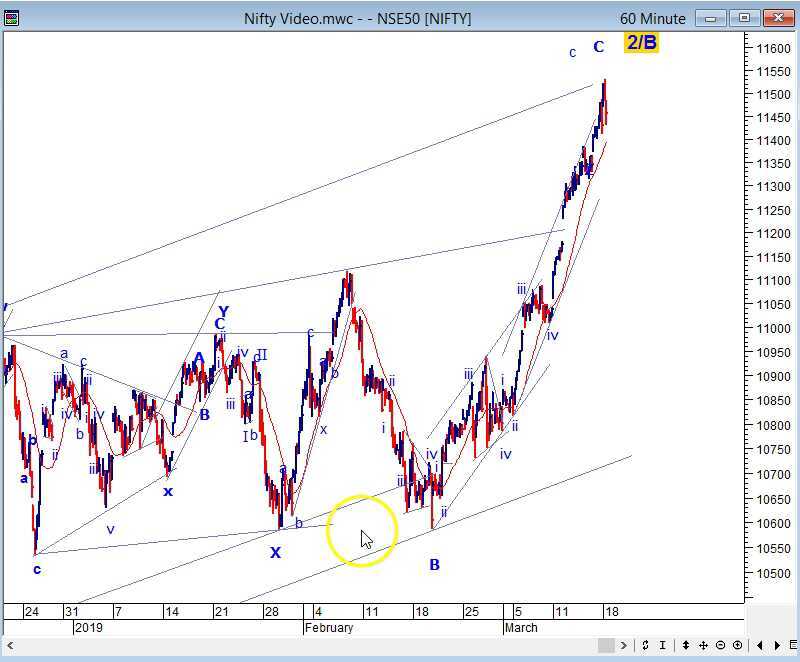
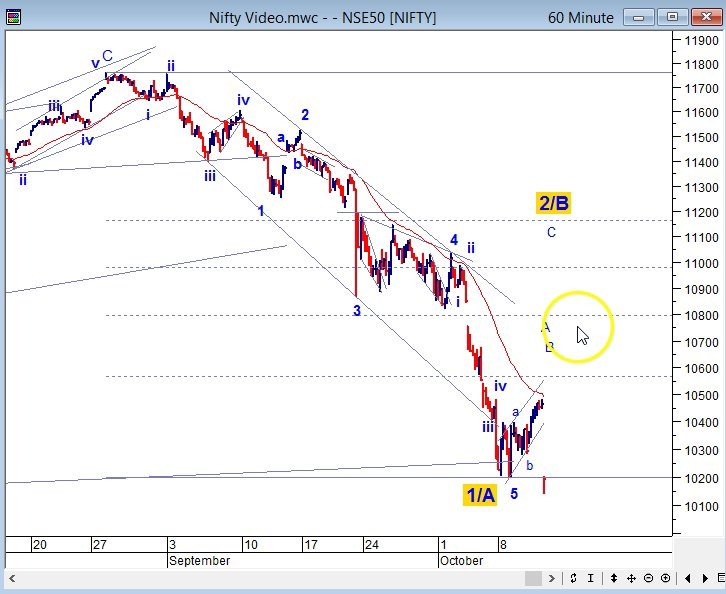
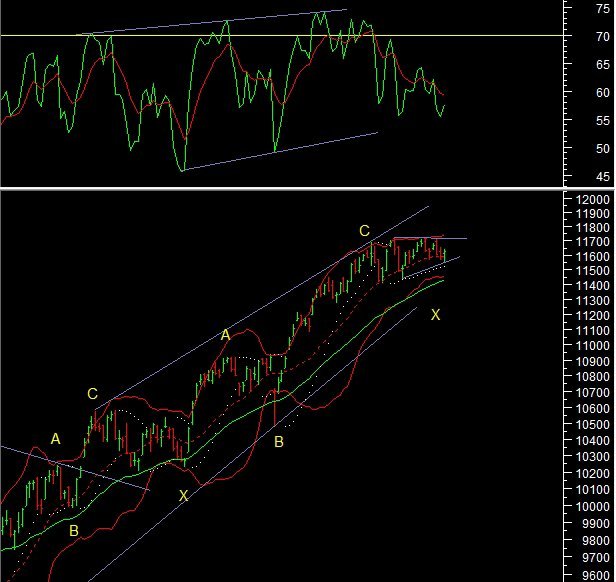
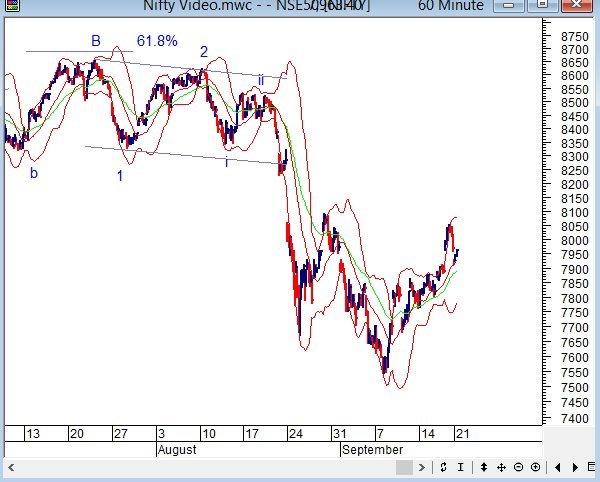
Wave 2 of B bounce is goind on and does not appear complete. 61.8% at 11566 remains open. Counter trend moves will complete in a-b-c.One more Monday gap up could do the job, if not a late day rally today itself
Nifty breaks the lows but it remains in wave 5 down so hard to say if we are ready to go to 9200 right away though below 10240 that is the ultimate target.
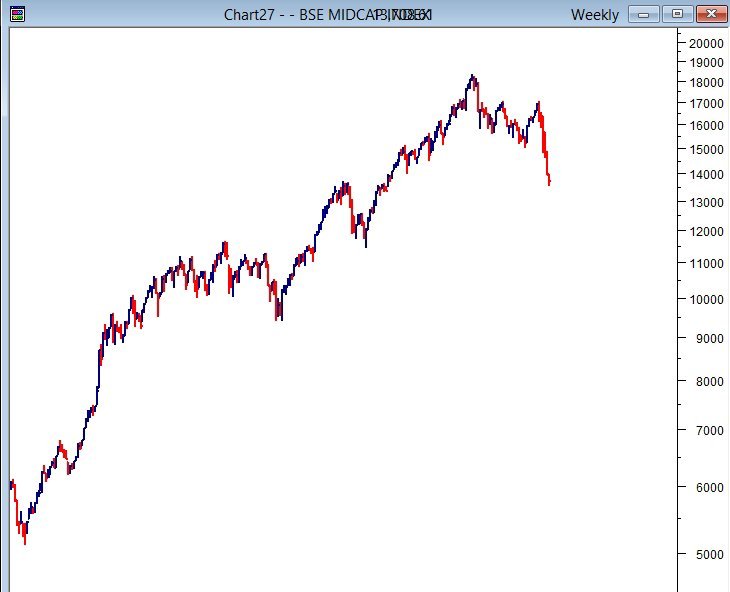
Third day of Nifty attempting to bounce and it should sustain and get past the 10518 level for the bounce to become a larger retracement of the 5 wave decline we have seen so far. The Midcap indices should continue to give us lead indications.
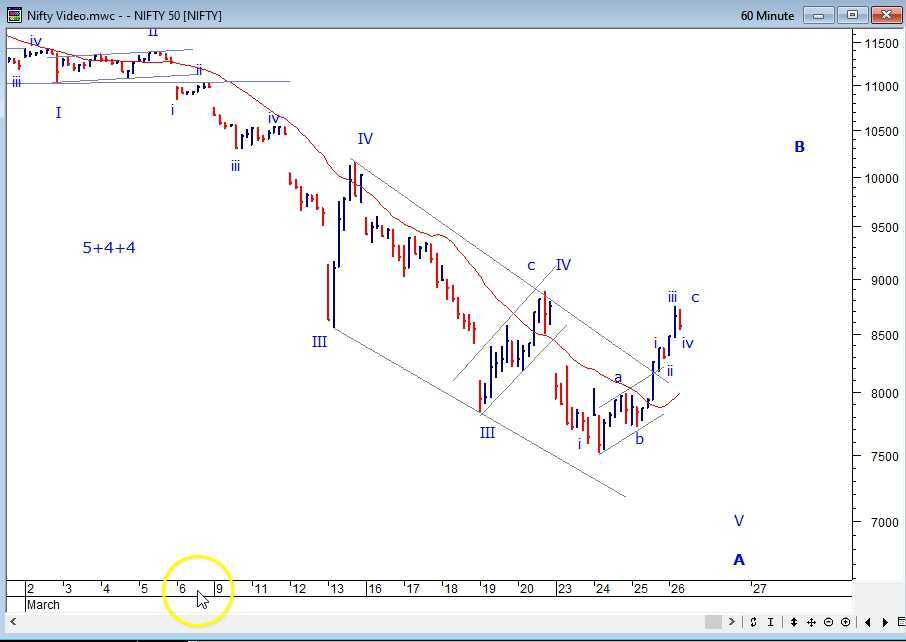
Nifty remains in wave 5 down for this market fall. How far down will Nifty go before it turns around?
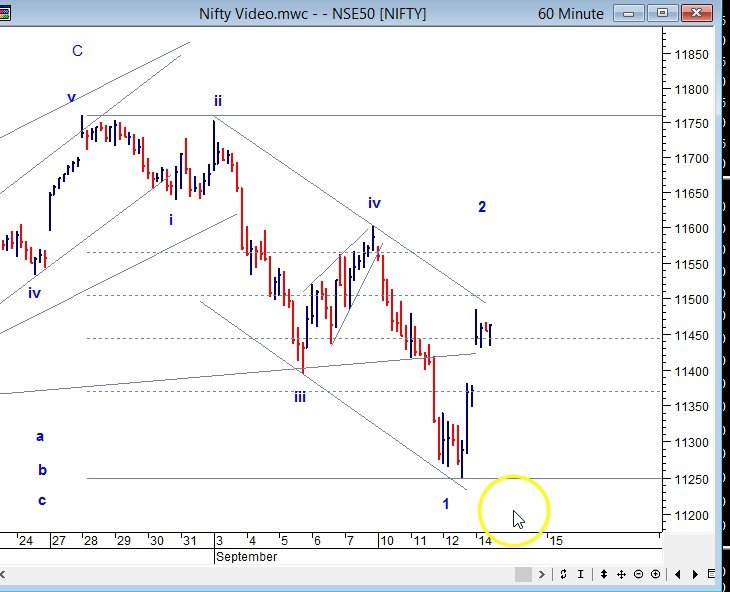
Nifty holding the 11250 low can still be in wave 2 before wave 3 down. Wave 2 can develop as a flat pattern with a retest of 11555 before heading lower. If 11250 breaks however then wave 3 down is on right away. Weekly cycles and IV and a holiday tomorrow are things to consider short term.
A review of where the Nifty is the target and levels to watch. Where indicators are and my observation of the market condition
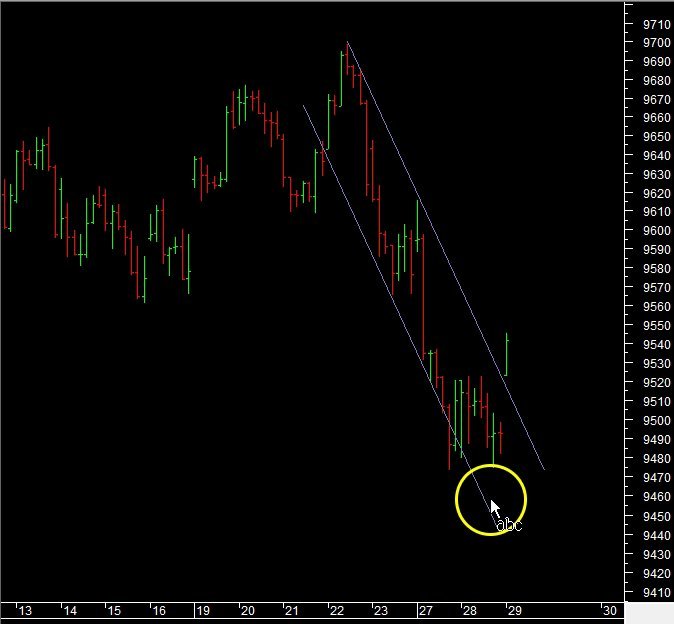
What are the implications of 9560 and 9532 breaking?
the short term structure and expecation from Nifty
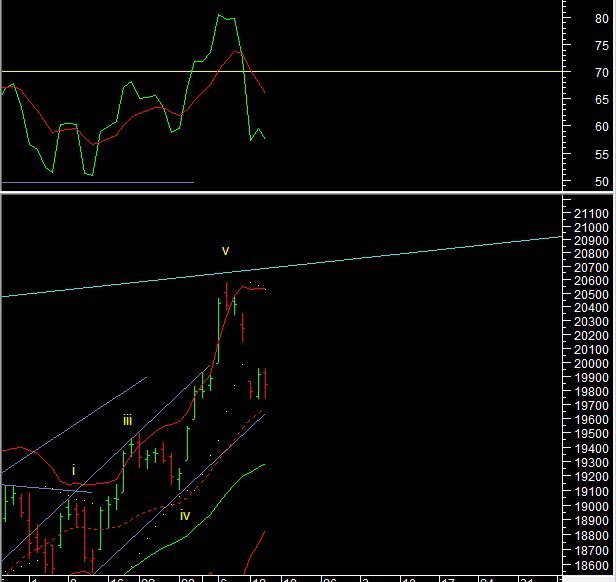
Development of a triangle on hourly charts testing the upper line at what level is it a breakout?
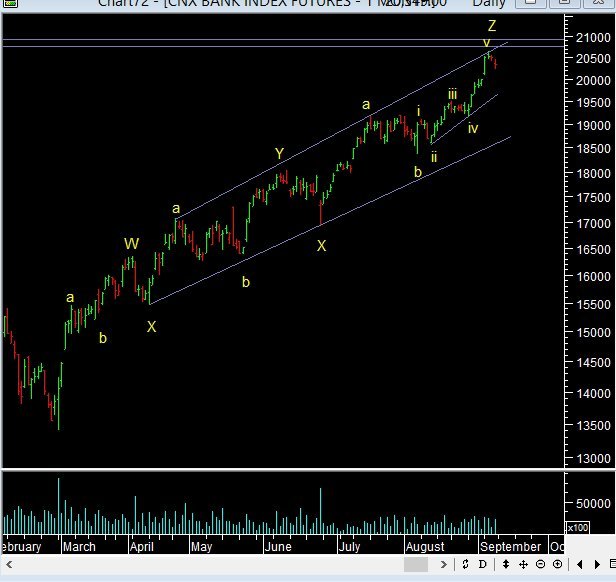
Wave v accross indices was expected yesterday but did it truncate and end? A little more confirmation from prices would say so on Monday.
Nifty has bounced and retraced as required now will we see the next major move down. Bank nifty says yes. However most averages are holding onto their 20dma and that keeps you in doubt to one final alternate for Nifty and the Dow as discussed.
Explanation of the Wave structure this morning and the way forward for Nifty and Midcap divergences
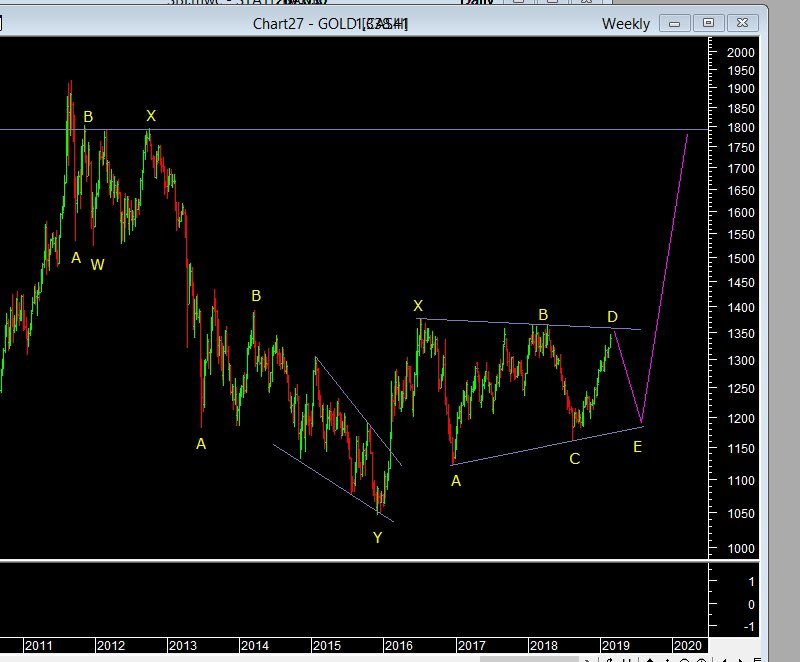
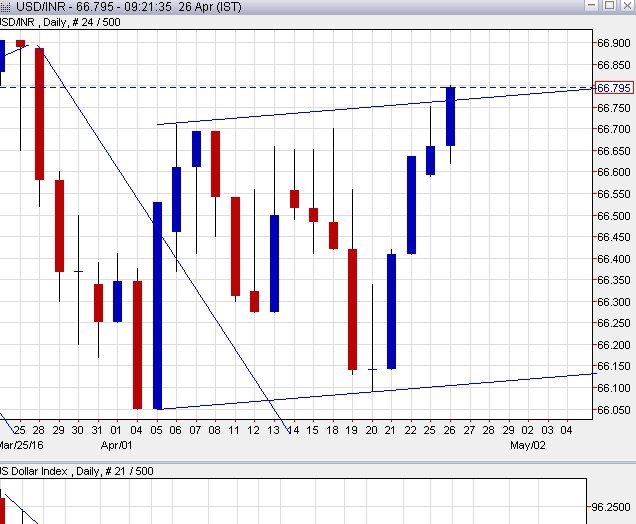
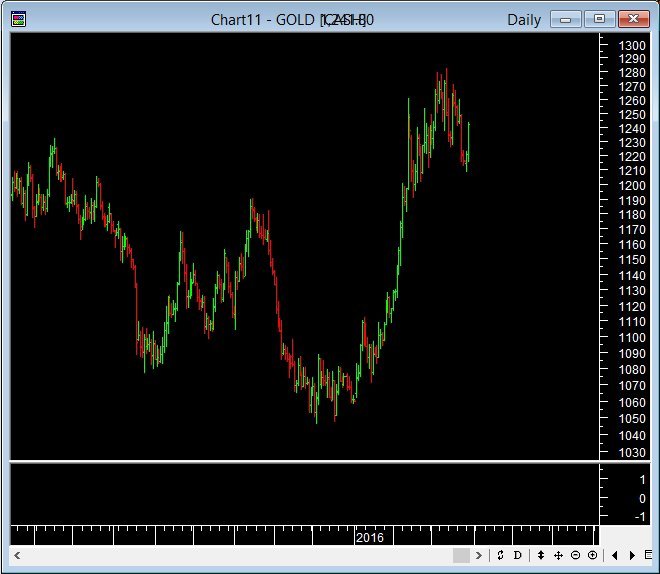
USDINR breaks out and Nifty forms a five wave decline however gold remains in a series of complex waves with no clear indication
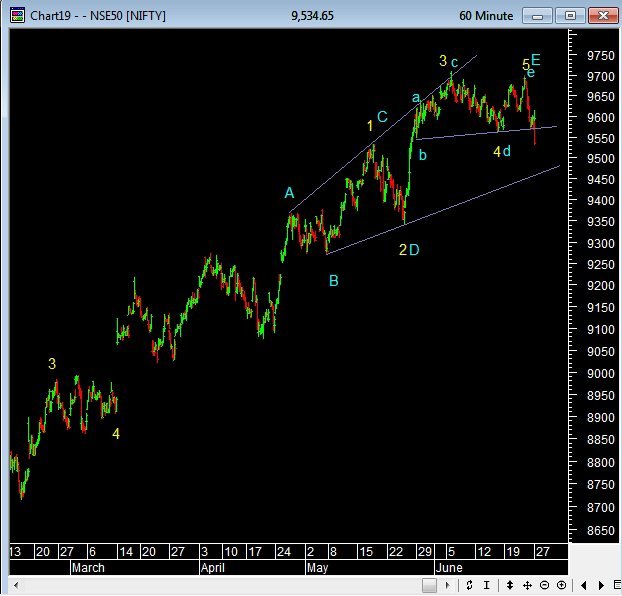
elliott wave analysis of the nifty hourly chart
A 5 wave fall in key indices on hourly charts confirms that the trend is down. Gold maybe about to breakout higher above 1235$.
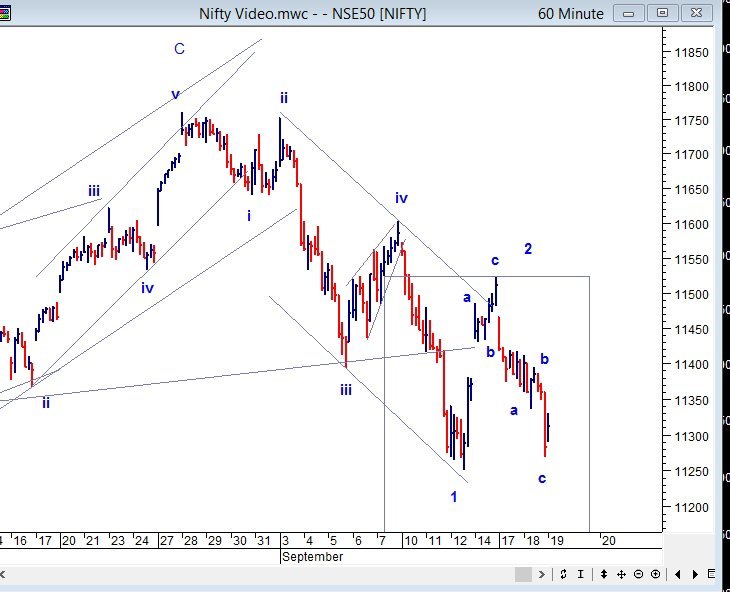
Elliott Wave discussion of the position of Nifty and how to count the waves from Sept to Date and why and what to expect going forward
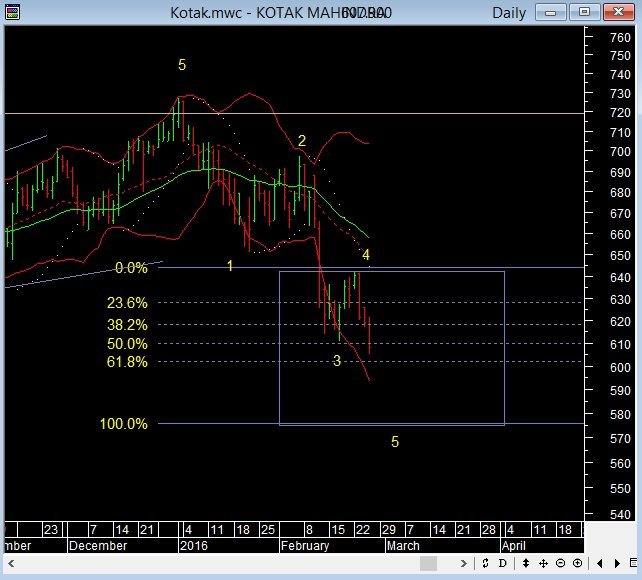
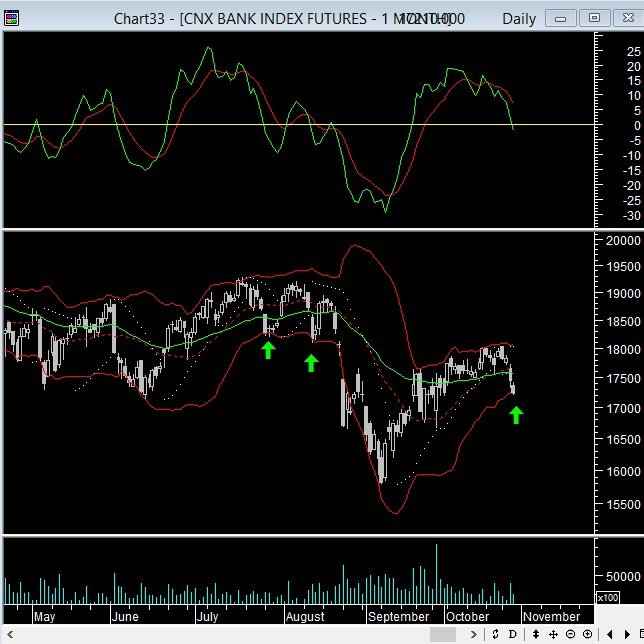
Bank nifty breaks out from a falling trend to form a impulse. Also key tools in TA to use in Position sizing and trade management revisited
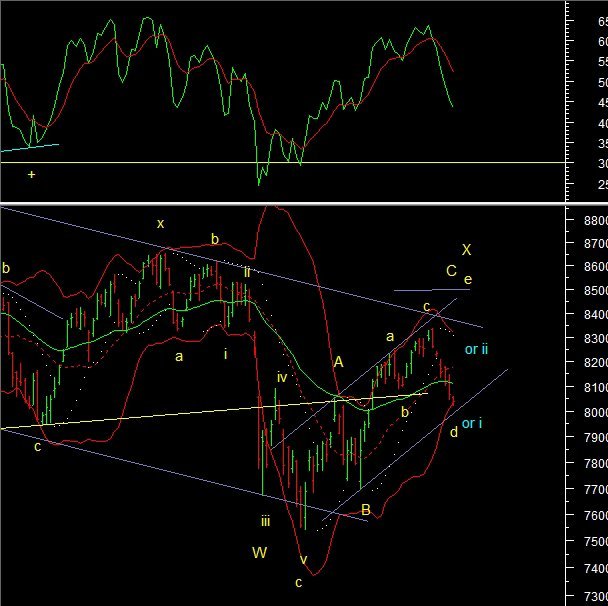
A detailed explanation of wave counts and why and how they were marked. Explaining the targets set out in the Long short report and the short term outlook
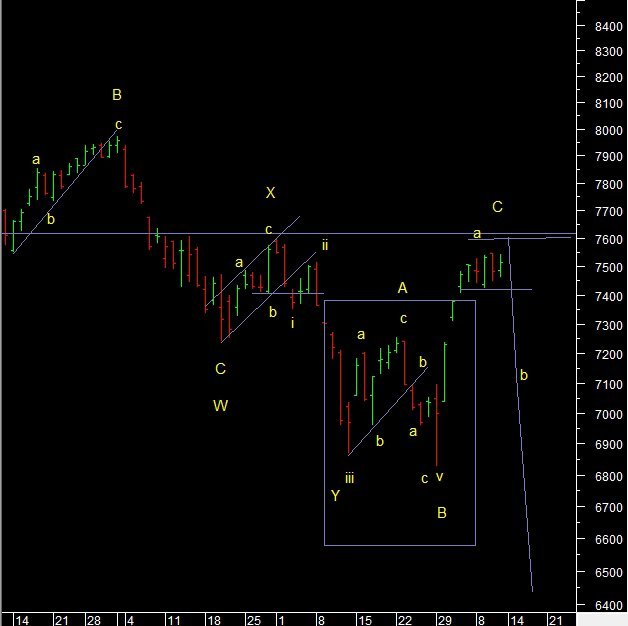
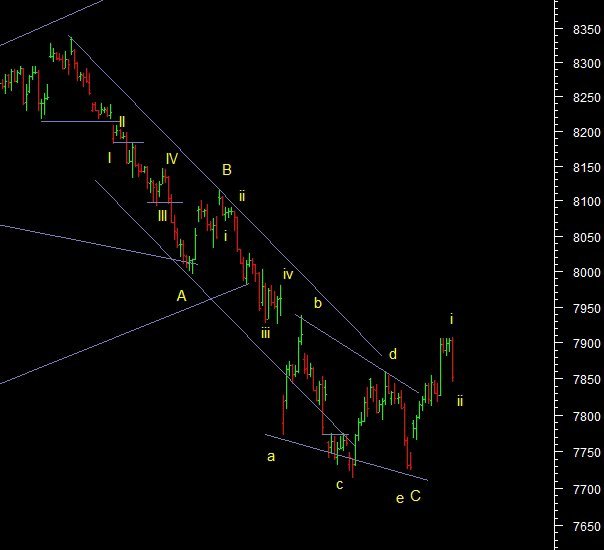
A post Diwali rally has stared and now we may head for higher targets as long as 7690 is held. Time is open till Jan 2016 for this move to play out.
The use of position sizing and daily charts to manage ones trading positions. Elliott wave explanation of the current position
Nifty outlook after the last 4 days of selling. What should be the strategy and what to watch out for.
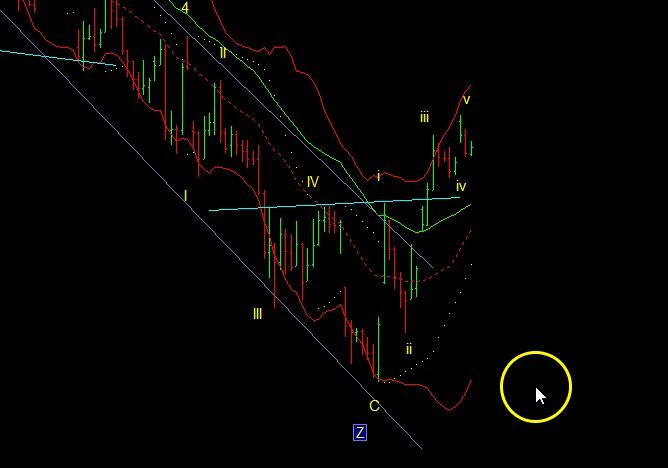
Head & Shoulder neckline being retested. A triangle might be forming below the neckline. Wave B or 4 forming. Waiting to confirm the next bigger leg down started
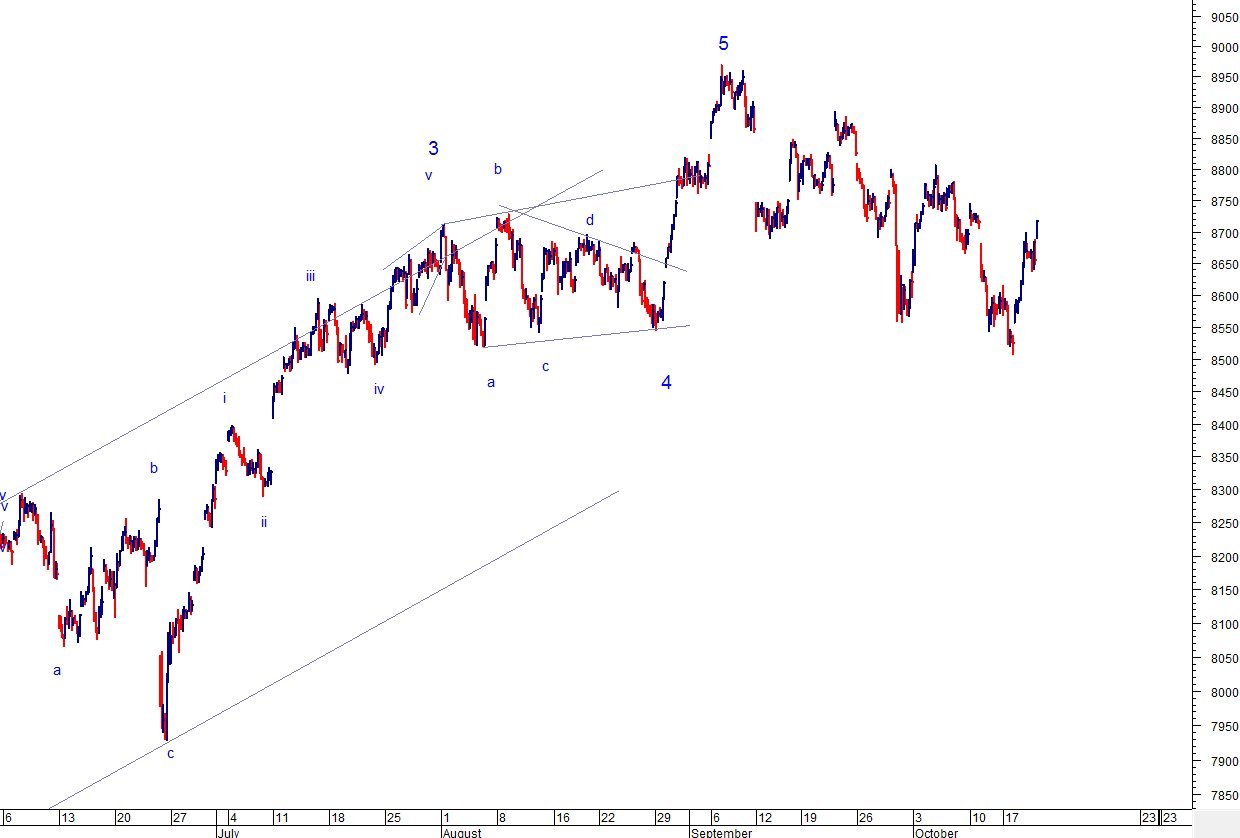
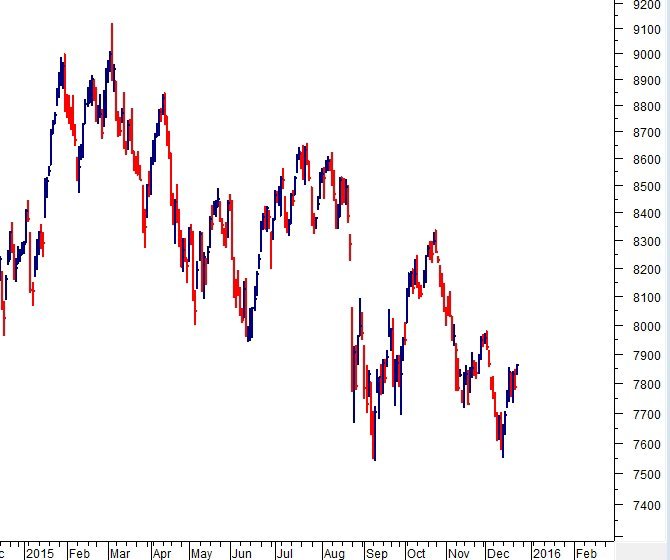
Nifty wave count from the July high. Alternate coutcomes and levels to watch. www.indiacharts.com
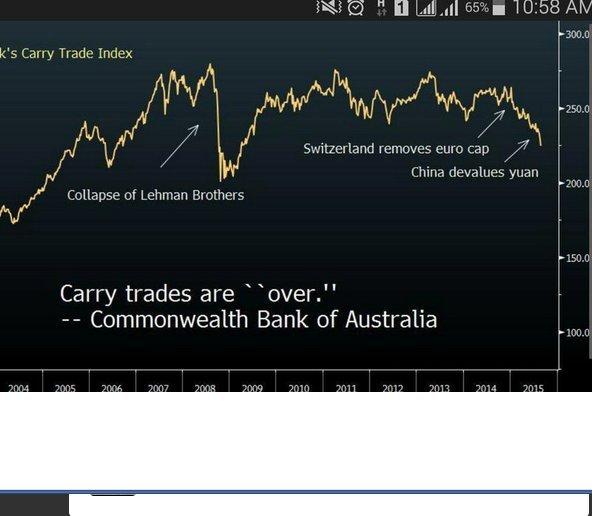
Bond Prices are gonig to turn down sharply and that might break the Bond Equity inverse correlation for the time being. Higher yields would impact all asset prices.
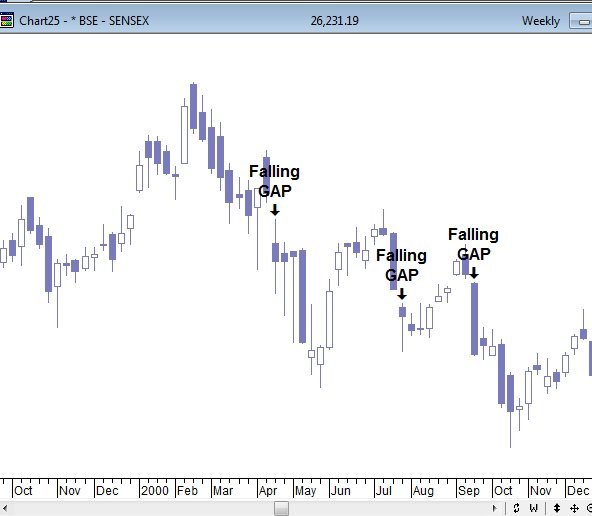
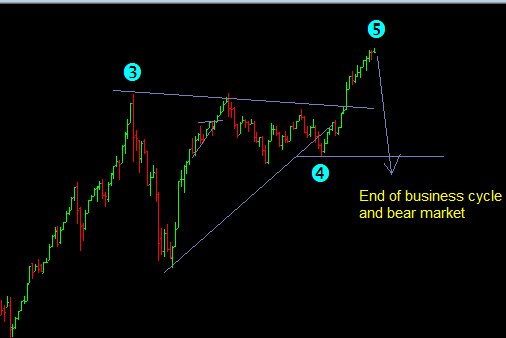
This is the 7th Weekly Gap down in the Nifty in 15 years and all world markets count as wave 4 up. This video explains the importance of this setup
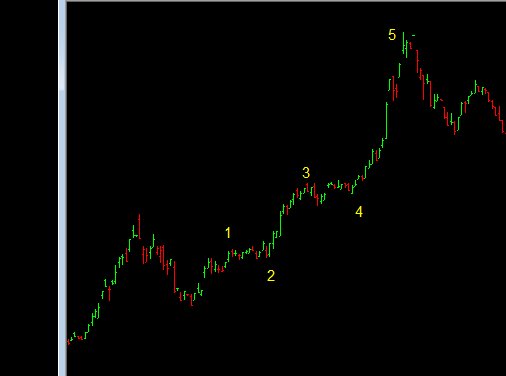
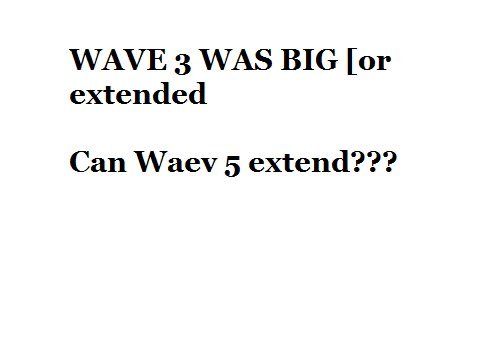
Wave 5 is forming and the question is will it subdivide or extend. This video throws light on that question with examples
Wave 3 was extended down with a GAP. Can the 5th wave also extend. This is an Elliott wave question and i answer it with examples from the past. And then forecast what to expect from here.
Market outlook Nifty Bank nifty and Midcaps and USDINR Currency
Long Short Video update 12 August 2015
Elliott wave discussion on the alternate wave counts and interpretations and the key issues and levels that need to be watched for the larger pattern developing.
Nifty structure and what are the alternate outcomes and levels to watch for the next few days.
Nifty overview from medium term to short term to answer whether the market will bounce first or fall first? What to do
Nifty Intraday wave count analysis and Big picture.